Introduction
This submission comes to us from an anonymous reader, who can’t publish the details under his (or her) name due to confidentiality issues. However, s/he has been able to generate some very useful charts with HighCharts using SharePoint list data as the underlying data sources.
Charting List Data with HighCharts
 In the following code, the source list contains columns with Year (string), Month (1-12), and Value (number with decimals).
While HighCharts isn’t free, the licensing costs are quite reasonable. A similar approach would work with other charting engines out there which may be free.
The page has a Content Editor Web Part dropped into it with the Content Link pointing to a file containing the following:
<!-- jquery and spservices are in the masterpage here this is a CEWP noConflict is on-->

<script type="text/javascript"src="//code.highcharts.com/highcharts.js"></script>
<script type="text/javascript" src="//code.highcharts.com/modules/exporting.js"></script>
<script type="text/javascript">
function GetYearSeries(series, year)
{
  var gotOne = false;
  var seriesOptions;

  jQuery.each (series, function(index, dataItem) {
    if (dataItem.name === year)
    {
      seriesOptions = dataItem;
      gotOne=true;
    }
  });

  if (!gotOne)
  {
    seriesOptions = {
      name: year,
      data: [0,0,0,0,0,0,0,0,0,0,0,0]
    };

    series.push (seriesOptions);
  }

  return seriesOptions;

}

jQuery(function($) {

  var CamlQuery = "<Query><OrderBy><FieldRef Name='Year' /><FieldRef Name='Month' Ascending='False' /></OrderBy></Query>";

  $().SPServices({
    operation: "GetListItems",
    async: true,
    listName: "Sales",
    CAMLQuery: CamlQuery,
    CAMLViewFields: "<ViewFields><FieldRef Name='Year' /><FieldRef Name='Month' /><FieldRef Name='Value' /></ViewFields>",
    completefunc: GraphIt
  });

  function GraphIt(xmlResponse)
  {

    var options = {
      chart: {
        renderTo: 'container',
        type: 'column'
      },
      title: {
        text: 'Sales'
      },
      xAxis: {
        categories: ['Jan', 'Feb', 'Mar', 'Apr', 'May', 'Jun', 'Jul', 'Aug', 'Sep', 'Oct', 'Nov', 'Dec']
      },
      yAxis: {
        title: {
          text: 'Value'
        }
      },
      series: []
    };

    $(xmlResponse.responseXML).SPFilterNode("z:row").each(function() {

      var seriesOptions = GetYearSeries(options.series, $(this).attr('ows_Year'));
      var month=parseInt($(this).attr('ows_Month'))-1;

      seriesOptions.data[month]=parseFloat($(this).attr('ows_Value'));
    });
    var chart = new Highcharts.Chart(options);

  }

});//docReady
</script>

<div id="container" style="min-width: 400px; height: 400px; margin: 0 auto"></div>
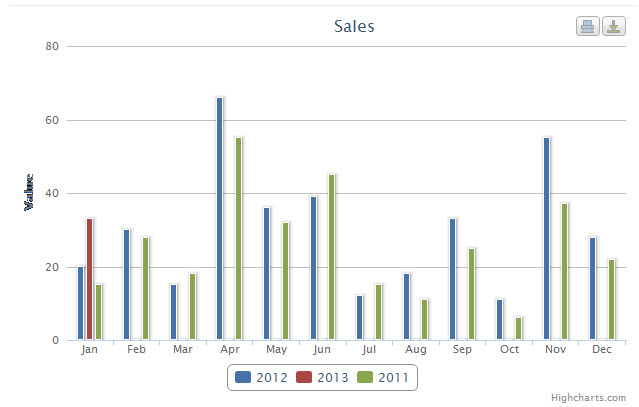
This generates a chart which looks something like this: